

A new section on council compositions is being added, with the first file examining political compositions for each local authority for each year up to and including 2015 now available.
Tables containing voting statistics are organised in one of two ways.
The first method organises data by theme. Themes include summary results providing party vote share, seats won etc; percentage turnout, number and type of candidates; summary results for each local authority; turnout, candidates etc. for each authority. Within each themed spreadsheet there are multiple sheets, one for each election year from 1973 onwards.
The second method organises data by year, 1973-2015. Within each spreadsheet there are separate sheets, one for each of the themes identified above.
Contact us if you have some ideas for data that you’d like to see tabulated.
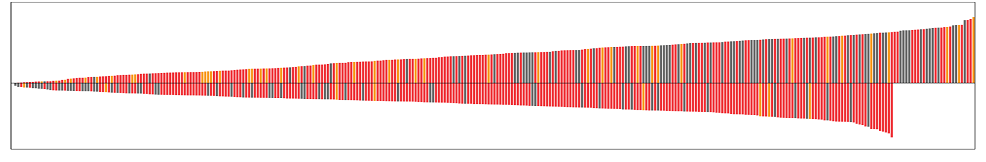
We like graphs as a way of displaying data. Again, if you have some data you’d like to see visualised then get in touch.